How We’re Improving Night Vision Mode
Canary uses an ambient light sensor to enter and exit night vision mode, while other consumer products with night vision rely solely on their camera to do this. Though every Canary is equipped with the same kind of ambient light sensor, there can be a wide variation in light response from one sensor to another. One of the engineering challenges our team has been working through is refining the embedded software for our ambient light sensor to better account for these variances. In this post, we wanted to share some of the techniques we’re using to further test and refine the performance of this sensor.
Why use an ambient light sensor?
Canary is designed to provide you with a round-the-clock view into your home. It includes a state-of-the-art HD camera with the ability to capture sharp video even in a pitch-black room. The picture quality in Canary’s night vision mode is clear and evenly lit thanks to 12 precisely positioned infrared (IR) LEDs that turn on automatically.

The Canary also contains an ambient light sensor to determine when it should enter and, even more importantly, when it should exit night vision mode. Having a separate ambient light sensor that is shielded from IR emitters has proven to be more accurate and more robust than relying on the camera image alone, as most consumer cameras do.
Understanding our ambient light sensor
Canary’s ambient light sensor is a photo-transistor, a semiconductor device that acts like a valve that regulates electron flow (or current) proportionally to the photon-flux (or light) that hits the sensor area.
This ambient light device and electronic circuit is quite sensitive and is set to measure light up to 150 lux, which is sufficient for a home environment. (As a reference point, a typical family living room illumination is about 50 lux).
Our sensor is linear in this range, which is another way to say that its readout is proportional to the amount of light. Or, in a more formal way we can say that:

The slope determines how much current flows per unit of light—the stream strength when we change the valve setting. The bias states how much flow exists when there is no light— the leakage of the valve. Such leaks exist in any electronic system, and are, among other things, a function of the temperature above absolute zero.
Therefore, to be able to determine the amount of ambient light required for night vision to operate correctly, we must first know the values of the slope and bias parameters of the sensor.
Moreover, the value of the slope and bias are affected by the manufacturer’s tolerances and are specific to each sensor. If we want each device to work as accurately as possible, we need to acquire this data for each and every device. That’s the fun part.
Finding the slope and bias
So, how do we obtain these values? At first glance it seems simple. All we need to do is expose the sensor to known illumination and then measure its response.
However, this seemingly simple test has three caveats:
- How do we ensure that the device is indeed exposed to a known illumination? We cannot simply use a light meter because we do not know exactly which “coverage area” our device is measuring and whether or not it matches the “coverage area” of the light meter.
- The measured values will not fit exactly on a line because of noise.
- How do we calibrate each ambient light sensor at multiple illumination values on an assembly line keeping in mind that the length of each test directly affects the number of units we can produce?
The second problem is solved in a standard way of line fitting, or as it’s known in statistics, linear regression. We do it in a way that minimizes the average square error, which is a simple method that assumes that all the points belong to the same model and the noise is Gaussian.
The first problem, however, is more difficult to solve. Knowing the exact coverage area and sensitivities within this area as well as the actual illumination at each point is not an easy task.
To ensure that the device is exposed to equally known illumination, we provide our reference light meter and our device with a uniform illumination field over a very wide field of view. We do this using a device called an integrating sphere. If you’re unfamiliar with this equipment, here’s how Wikipedia defines it:
“An integrating sphere (also known as an Ulbricht sphere) is an optical component consisting of a hollow spherical cavity with its interior covered with a diffuse white reflective coating, with small holes for entrance and exit ports. Its relevant property is a uniform scattering or diffusing effect. Light rays incident on any point on the inner surface are, by multiple scattering reflections, distributed equally to all other points. The effects of the original direction of light are minimized. An integrating sphere may be thought of as a diffuser which preserves power but destroys spatial information. It is typically used with some light source and a detector for optical power measurement.”

What does this means in simple language? First, we take a relatively large sphere and we paint it matte white on the inside, and make two relatively small holes (or “ports”). If we then illuminate the sphere through one hole and look into the sphere from the second hole, we’ll see a uniform brightness field as far as the eye can see. This is true only if we cannot see the light source itself, which may not be uniform. We achieve this by hiding the light from the viewing hole (the “exit port”) of the sphere.

Once we have done this, we can measure the now-uniform field with a light meter and compare to the Canary light sensor. We take multiple measurements and find the parameters using linear regression as mentioned above.
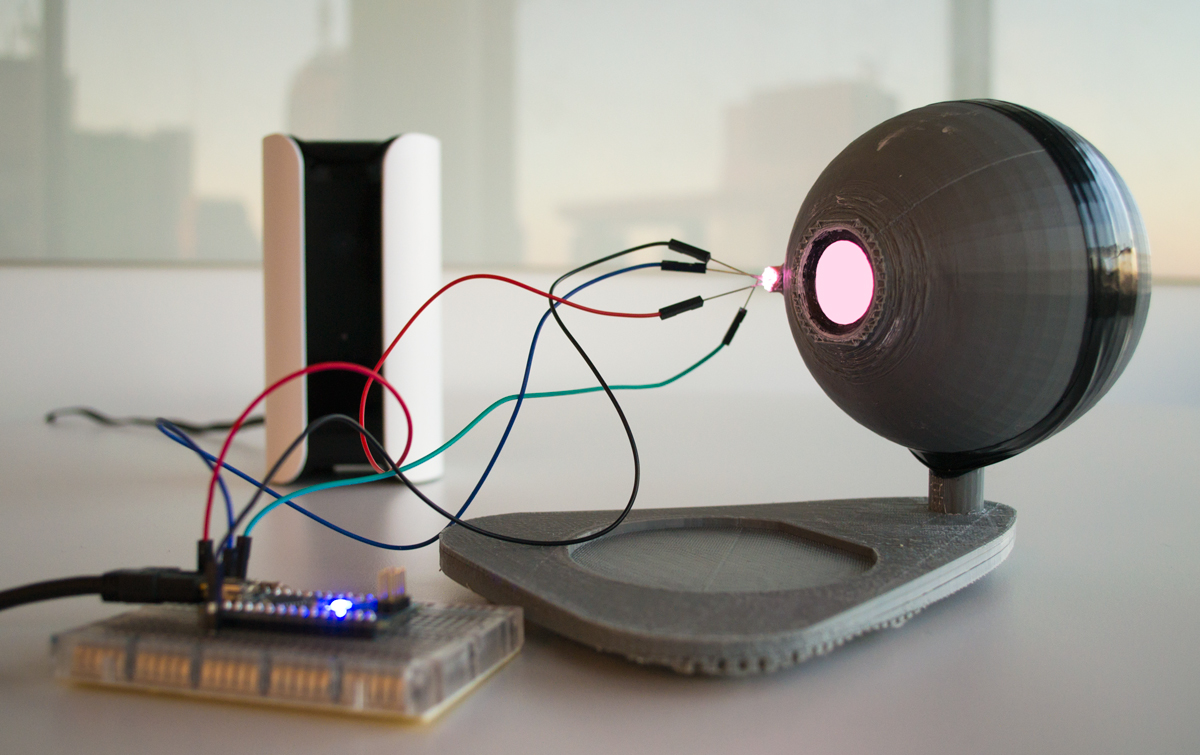
Building a Canary integrating sphere
A commercial integrating sphere like the large one shown above can be very expensive. Even a small sphere—one not much larger than a baseball—can cost thousands.
We are only concerned with visible light for tuning the ambient light sensor, so we built our own custom integrated lighting sphere to allow us to perform the tests necessary to optimize the threshold of our night vision switch. We used our Makerbot to rapidly print 3D models of these custom spheres so that we could work through this issue quickly and efficiently. We also put together the illumination controller using an Arduino. The Arduino generated a pulse width modulating (PWM) signal to control the illumination intensity and color, and to obtain a variety of white color temperatures.


How this helps us
After designing the integrating sphere and fitting it with the Arduino-powered lighting controller, we were able to create a suite of tests that allows us to compensate for tolerances in the manufactured ambient light sensors and calibrate them in less than 30 seconds. The key is that this is precise, consistent, and repeatable—we can do it on millions of Canary devices. For users, this means that as the lighting in their home changes, Canary will know precisely when to enter and exit night vision mode to provide the clearest view of the space.

Hardware, software, and manufacturing
This case study is an example of how we are solving product issues through integrated hardware, software, and manufacturing innovations. This solution provides both speed and accuracy—obtaining detailed data for each sensor just like in robust engineering testing, but doing so quickly enough that we can integrate it into the quick pace of our manufacturing line.
Open-sourcing our solution
It’s incredible that with a 3D printer and open-source hardware, we were able to rapidly prototype and develop a solution that replaces the need for multi-thousand dollar test equipment. Thanks to these tools, we’re able to innovate in ways that not only speed up our process and improve Canary, but can help the field at large. With this in mind we’re open-sourcing our Integrating Sphere schematics, 3D modeling, and Arduino code:
You must be logged in to post a comment.